1. Music Generation (using LSTM)
This project is about generating music using music data. I decided to take up this project due to my love for music and a way to learn in depth about Recurrent Neural Networks and LSTMs. I am using RNN and LSTMs in this project because I do not want each and every data point to be treated independently but in relation to a combination of previous data points. Before using LSTMs, I was getting a repetitive output and hence, I decided to use LSTMs to get better control of memory of the past data to be preserved. The end result is a midi file containing music generated by the model.
*I am currently working on this project
Data and Tools:
I collected data from youtube in mp3 format(200 songs) and converted to midi for ease of processing right notes. The modules and frameworks I am mainly using are Music21 and Keras.Summary of my approach:
1. I started by parsing all the midi files and extracting all the notes and chords from it by using Music21. 2. I prepared sequences of notes to be used by the neural network as its input after mapping the strings to integers as neural nets works best with the integers. 3. I took the sequence length to be inputed to be 70 and the immediate note after 70th note was taken as the output. 4. I normalized the input and converted the output to categorical variables. 5. I built keras sequential model with 3 LSTMs and softmax activation functions. For finding loss, categorical cross entropy was used. 6. Fitted the model with 100 epochs and 64 batch size. 7. Started preparing for prediction by taking random sample from training set and inputting in model.predict. 8. Saved the output as a midi file by appropriately detecting notes and chords and converted midi to mp3.Result:
Audio files below show some of the outputs my model gave. I am still working on improving the model.2. Recommender System
1. Objectives:
1. To identify different customer segments in the data set so that Google can understand customer preferences with respect to the merchandise. This will help Google and third party sellers devise and implement targeted marketing campaigns for certain types of products. 2. For customers within a segment, identify products that they might be interested based on what the peers in the segment have viewed and/or purchased. This will help Google provide a personalised service to the customers while also increase the time spent on the website in the hope that the customers will eventually make a purchase.
2. Data:
For this project, I used the google merchandise store dataset which can be found here.
3. Data Cleaning:
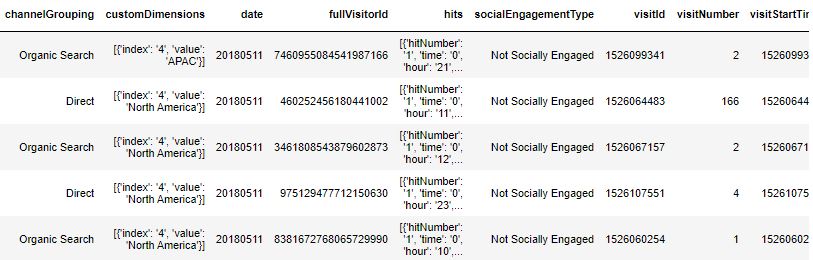
I extracted the dataset using Google BigQuery. Image below shows the initial few rows of the dataset. The dataset has information about the customer behavior per visit, like, the number of products that the customer viewed, each product information(name, price, category), geographic location, number of pageviews of a customer, Operating system info, etc. Though the data extracted was in a csv format, the challenge was to extract product and transaction information (hits column) that was stored in a JSON format in each cell of its column. I worked on extracting product info at customer level, where every customer viewed multiple products in every visit. .As Regular JSON reader was not helpful as the data was in an incorrect string-literal format and henhce, I wrote a customized json parser.
Before I started forming models, I wanted to merge JSON parsed customer data with main dataset to add more features like, location, date, etc. an important step was to split the categories in product data into individual categories. For example, if category was a string “Home/Apparel/Men’s/T-shirts”, I split the string into 4 categories - Home, Apparel, Men’s, T-shirts as category1, category2, category3 and category4. Data extracted from “hits” and factorized columns from main dataset were merged into a new dataframe to use for modeling.
4. Exploratory Data Analysis:
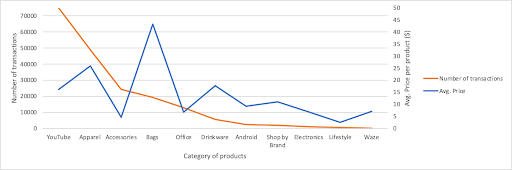
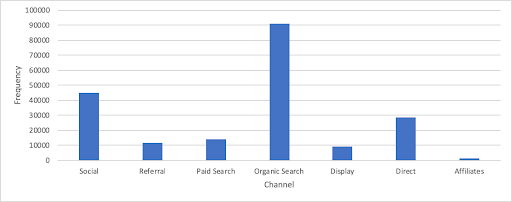
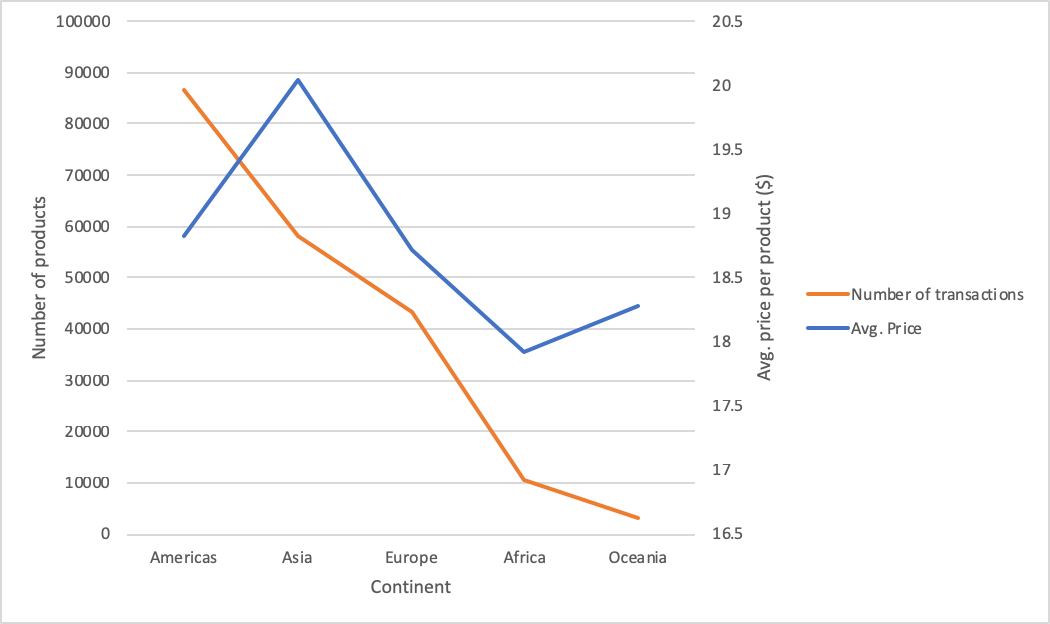
After getting the cleaned data and before forming models, I wanted to get to know the data better and find out some interesting trends. Images below show the sample of EDA that I conducted. The first image shows the variation of number of transactions and average price of the products across product categories. The second image shows how the customers got to the website and the third image shows variation of number of transactions and average price of the products across different locations.
5. K-means Algorithm for Clustering:
K-means algorithm is an unsupervised machine learning algorithm that aims to form clusters in such a way that it has minimum within cluster variance. It starts with random k cluster points and allots a cluster to each data point based on proximity. It recomputes the centroid at each stage and keeps doing the same till the clusters no longer change. It can do the process many pre-specified number of times with each time starting with new random centroids.
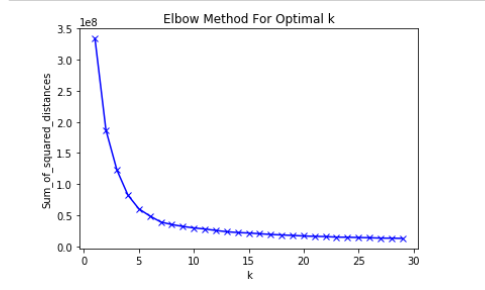
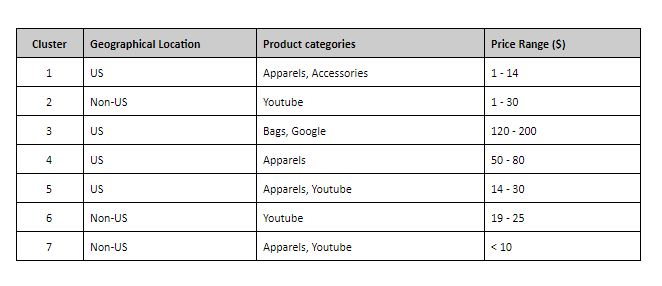
I decided to use K-means for dividing customer into groups of similar users and their viewing history. The first step for performing k means was to convert categorical variables into numeric values and then to scale them. Scaling was important as k means forms cluster based on the distance metrics. Then, I used the elbow method to find the optimal value of k=7. Image below shows the elbow plot.
6. KNN (K Nearest Neighbour) Algorithm:
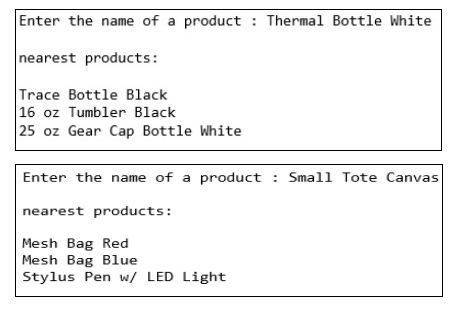
The intuition behind the KNN algorithm is one of the simplest of all the supervised machine learning algorithms. When a prediction is required for a unseen data instance, the kNN algorithm will search through the training dataset for the k-most similar instances by calculating distance (Euclidean, Manhattan, etc.) to all points in the training dataset. It then selects the K-nearest data points, where K can be any integer. The prediction attribute of the most similar instances is summarized and returned as the prediction for the unseen instance. Finally it assigns the data point to the class to which the majority of the K data points belong. I used K-nn to create a recommendation system that recommends top 3 similar products to a customer who is viewing a product on Google platform. Image below shows some sample result.
7. Business Applications:
1. Customer segmentation based on clusters can be used for effective marketing strategies: Retail marketers are constantly looking for ways to improve the effectiveness of their campaigns. One way to do this is to target customers with the particular offers to deepen customer loyalty and improve revenue generated per customer. Marketer’s goal is to make the most relevant match between customer and offer. This can be achieved by targeting specific groups of people with concentrated interests. Clustering similar customers together is a practical method to improve the effectiveness of marketing. Recommending similar products to a user viewing a product on Google platform One of the best tools a retailer has for selling products to customers is providing product recommendations. And customers love product recommendations that are tailored based on their interests and historical behaviour. The recommendations are also a way to improve customer loyalty and hence, increase customer lifetime value (CLTV).
Please visit my github page for more projects. Links to my github and Linkedin are in the in the footer and header.