Merhcant Transaction Analysis: Loan to be granted?
This project is about analysing merhcant transaction data to find out patterns that show if the merchants can repay the loan back or not and hence, determine if the loan should be granted. Also, the aim is to find out the risk in merchant's business so that interest rates can be determined accordingly.
Business Problem: Minimizing loan default rates.
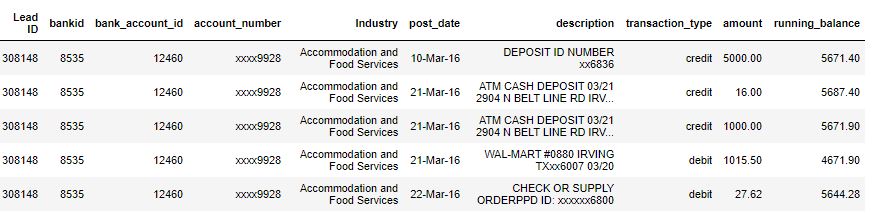
Understanding Data: Dataset has 10 features and around 29000 transaction data for merchants. Following image shows the initial 5 rows of the dataset where Lead ID is the merchant id, bank id and account number are for all the banks a merchant is associated with and the other fields provide information on the actual transactions by the merchants. . The dataset has data for 21 merchants and 10 banks.
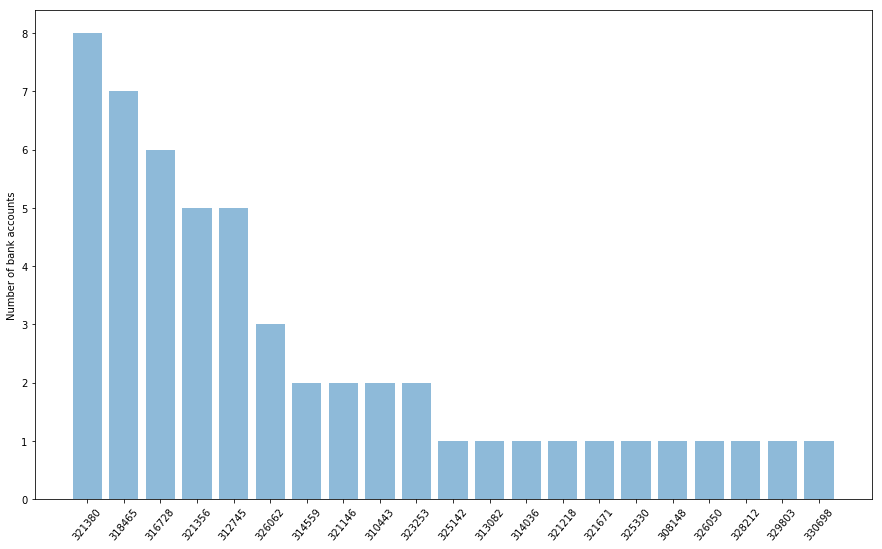
Analyzing merchant id, bank id and bank accounts: As the first step of analysis, I looked at the relation between merchants and number of bank accounts they have. Following image shows that 5 merchants have more than 5 bank accounts. Next, I need to see if transaction is done in all the bank accounts on a daily or atleast monthly basis.
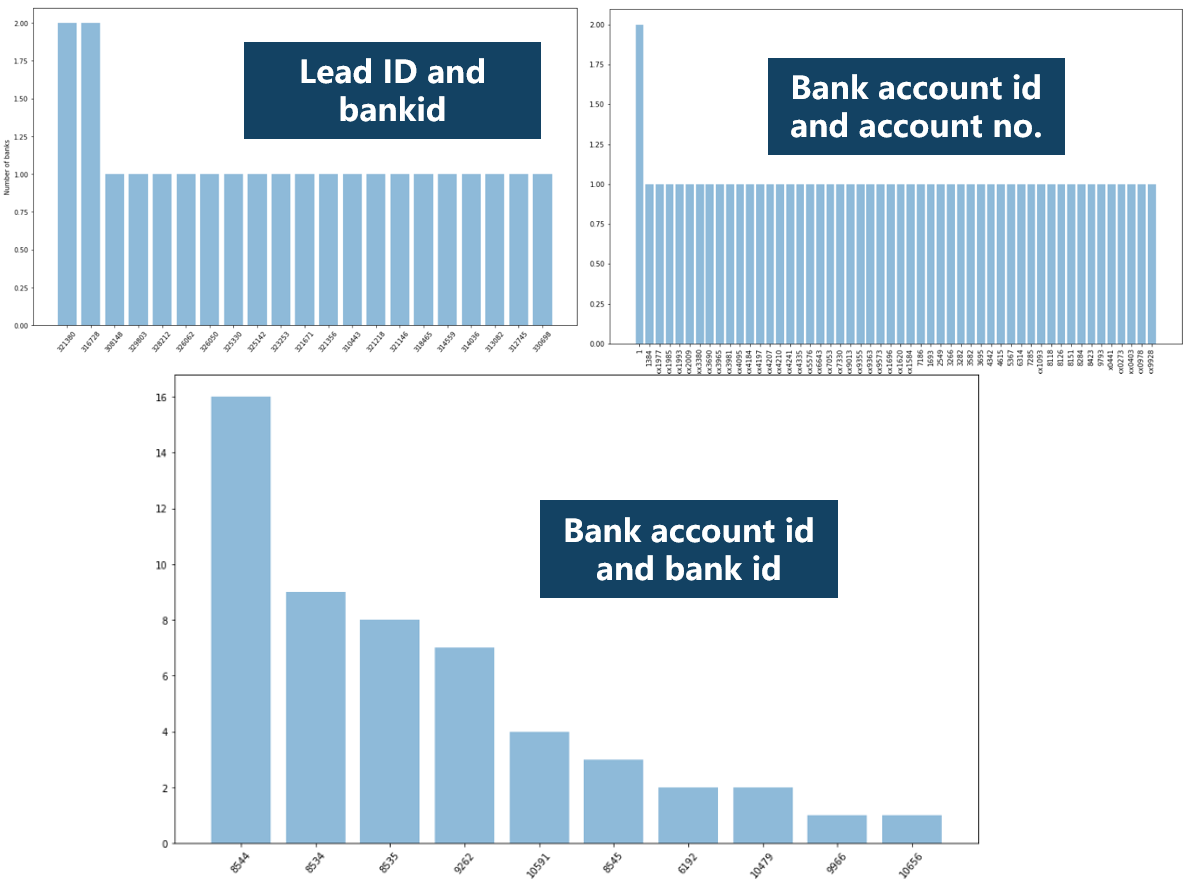
After looking at the transaction rate, I found that most of the bank accounts are used atleast once a month for atleast 8 months, which is good. For the bank accounts that were used for less than 2 months, they seem new. Image below shows the relation between merchants and banks and banks and bank accounts.Although as previously seen, a merhcant can have many bank accounts but they have it in a same bank. And, as expected, a bank varied number of bank accounts. Also, we can remove the feature bank account number as it serves no additional purpose.
** I will be using Lead ID's 318465 and 316728 for further explanation for the sake of convenience
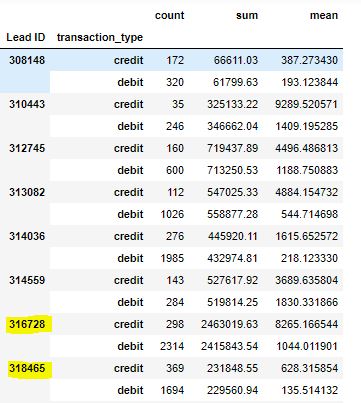
Analyzing credit and debit amount for the merchants: This is important to see if merchant is capable of making profits and therefore is able to return the loan or not. Analyzing the monthly credit and debit details for the merchants 318465 and 316728, I found that both have more debit than credit for almost all the months. The snapshot below shows the aggregated data for all months showing that both the merchants have higher credit than debit over months and hence, may be able to repay their loan.
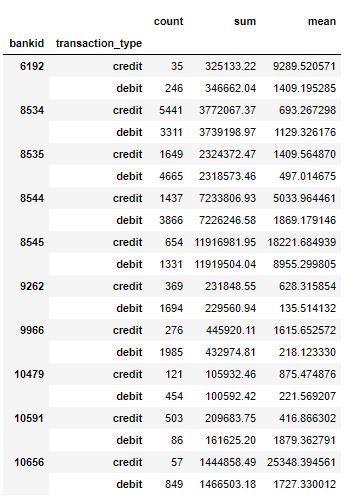
Additional Credit and Debit Analysis: Before diving into further analysis for the 2 merchants, I wanted to look for any patterns in banks and industries based on credit and debit. Analysing the industry on the basis of credit and debit amount, I found that the construction industry has the highest amount of transactions where as the educational services has the least. Analysing the banks on the basis of credit and debit amount, as the following image shows, bank 8545 has maximum amount of transactions and bank 8534 has maximum count of transactions.
Daily Transaction Analysis: I plotted the time series of transactions for each of the 2 merchant to see their daily credit and debit spend. Image below shows daily transaction details of the merchant 318465. We can see that there is a sharp increase in the credit and debit amount on 14th of November. It is not due to children's day but due to another loan granted on that day which was immediately taken out. This shows us that this merchant already has taken a loan and is need of another loan and hence, is a bit risky and this merchant was in desparate need of money as the amount was immediately withdrawn. Also, the daily balance is negative on 14 days out of 244, which is a little risky
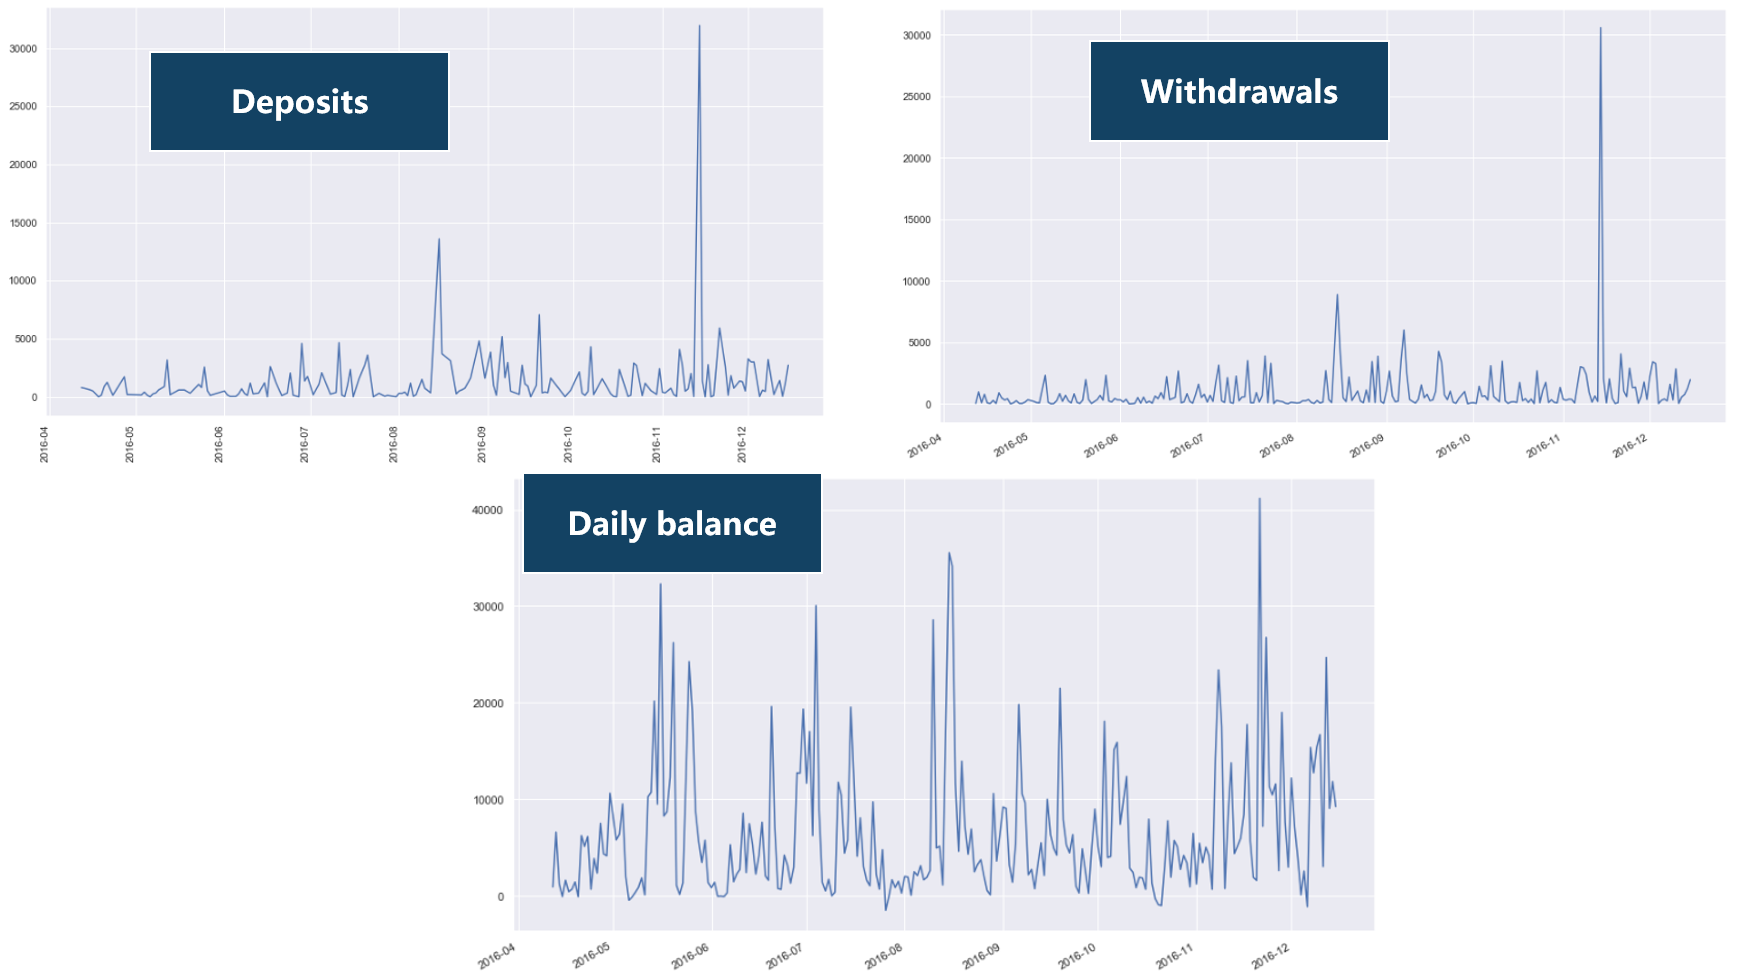
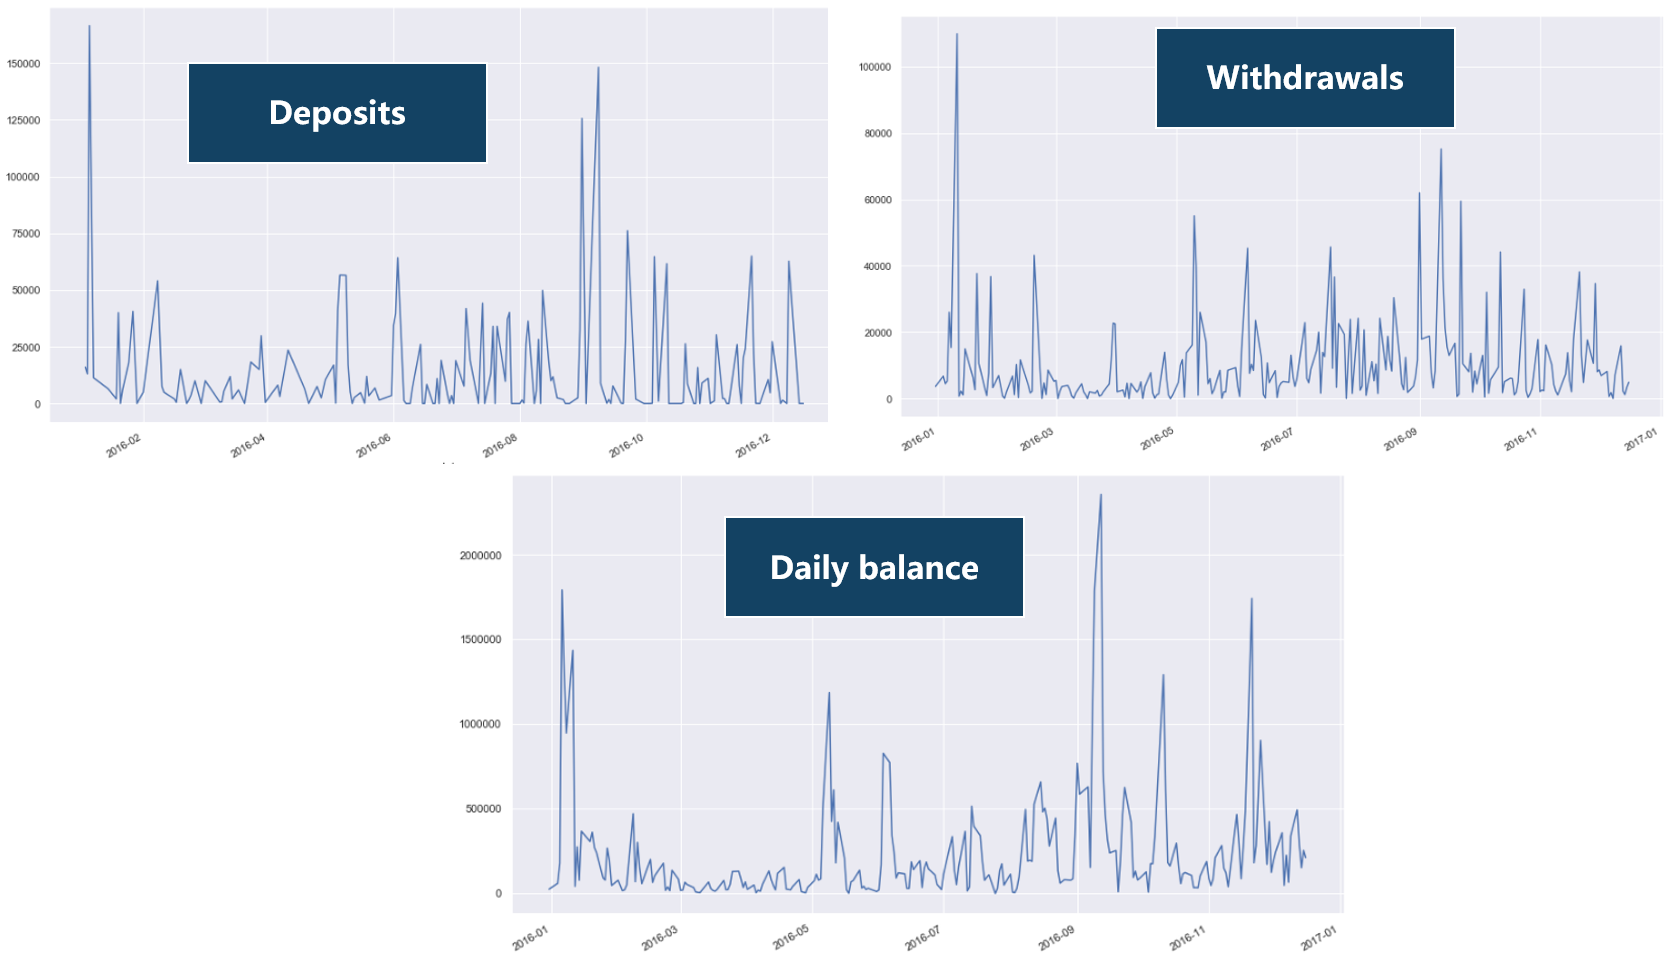
Image below shows daily transaction details of the merchant 316728. We can see similar spikes but not on the same day and the reason is not a loan in this case but is random transactions. Also, the daily balance is negative on only 2 days, showing that this merhcant is less risky. Next, I wanted to dive deep into merchant risk analysis.
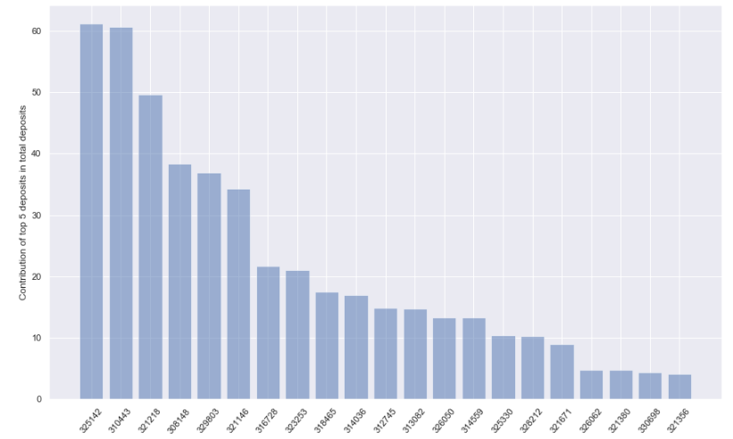
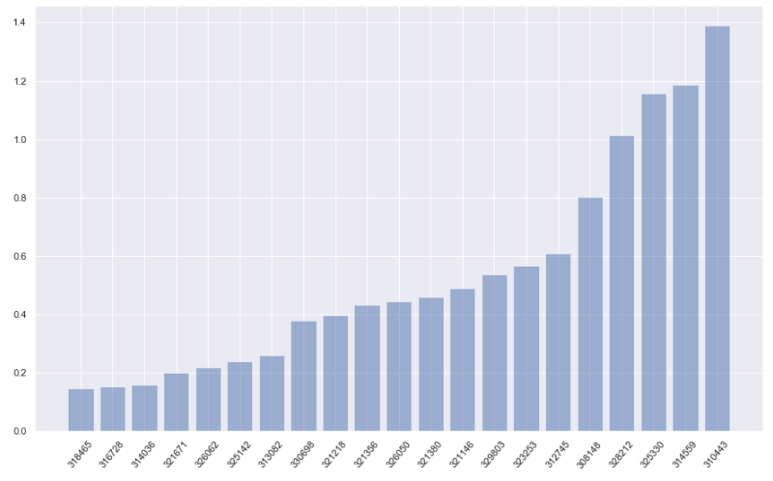
Merchant Risk Analysis: I am using 2 methods to find the merchant risks. One is the contribution of top 5 deposits in total deposits and the other is the Average number of days between 2 withdrawals. If contribution of top 5 deposits in total deposits is high, it means that a merchant is mostly depended on a few clients which is risky and if the average number of days between 2 withdrawals is low, it means that the merchant needs money often which can be risky. The first image below depicts the contribution of top 5 deposits in total deposits where as the second image depicts the average number of days between 2 withdrawals. As We can see from the first image, both the merchants (318465 and 316728) have their top 5 deposits contributing to around 20% of their total deposits which is slightly risky and as per the second image, the average number of days between 2 withdrawals is the least for the 2 merchants making them risk prone.
Conclusion: For the 2 merchants I analysed, both of them look risky with 318465 being more risk prone. Hence, even if the loan is granted, interest rates should be decided accordingly.
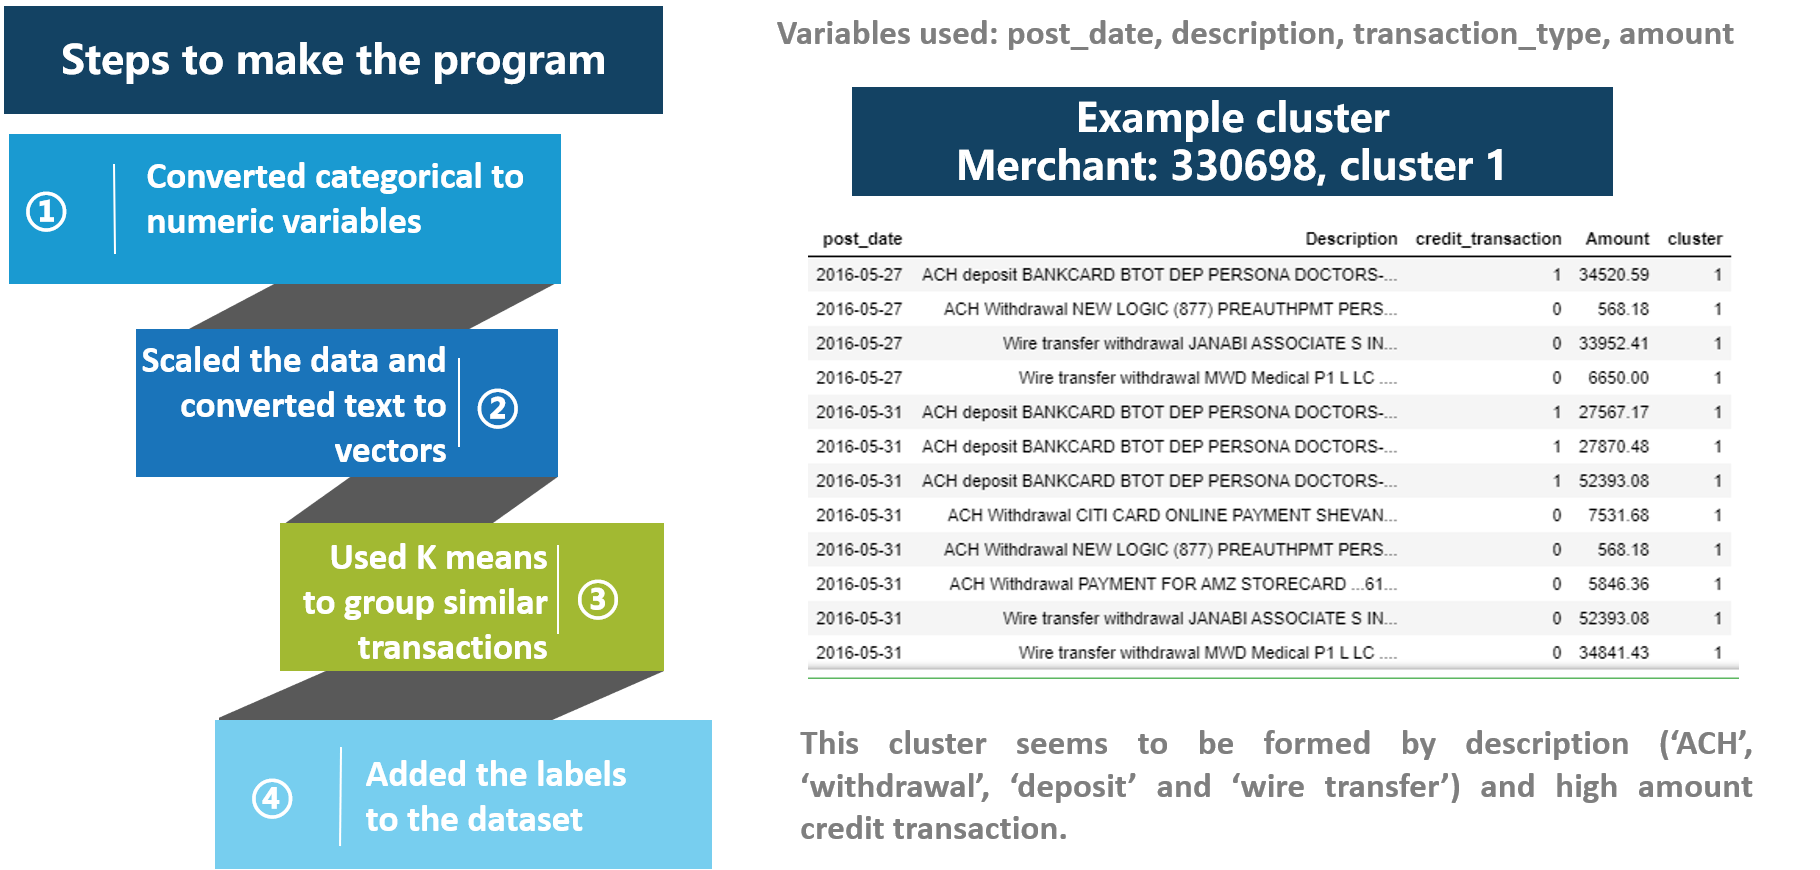
Additional step: I used K means clustering to cluster the data by transaction so that I can group similar transactions for a customer which could be useful in future analysis including fraud detection. Image below shows the steps for clustering and a sample cluster formed.
Please visit my github page for more projects. Links to my github and Linkedin are in the in the footer and header.