Capital One Hackathon-Winner-
Problem statement: Measuring Gender Equality and Work-Life Opportunities at the workplace
Tools Used: Python, nltk, Machine Learning, Web scraping, Tableau

Motivation:
According to a Mckinsey Report, if a company becomes more diverse, it is 21% more likely to see above average profits and according to a report by IBM, if a company fully focuses on gender diversity, it sees higher profits and revenues by ~10% points. Looking at these numbers, I felt that if I could help company figure out where they stand in terms of gender equality and work-life opportunities with respect to the other companies and eventually improve, they can increase their profits and revenues. .My approach:
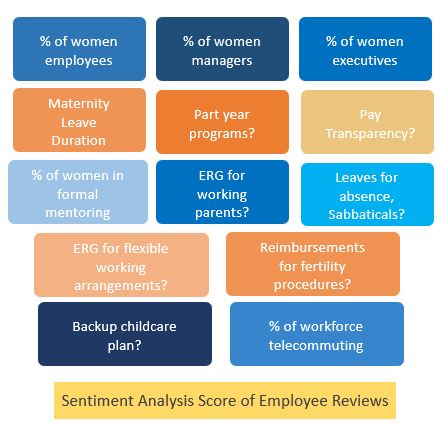
1. Research After understanding the problem statement and finding my motivation, I started researching about what contributes to the gender equality and work life opportunities at a workplace and if data for same is available. After researching several websites, I decided to work with 13 metrics such as % of women executives, work from home option available, pay transparency, maternity leave etc.
2. One more metric: After further thinking, I realized that the 13 metrics I have decided to work with, only tells what an employer is offering and not what the employees feel about what is being offered to them. Hence, I included the 14th metric which is the sentiment analysis of the employee reviews. I webscraped the data and conducted sentiment analysis using nltk.
Score Calculation: I gathered the data for all 14 metrics for around 100 companies and created a form for Capital One to enter its data. Then, I calculated the scores for individual companies by assigning non-equal weights to each metric and taking the weighted average of them.
Comparison and Recommender system: Now I had score for all the companies and data of 14 metrics for each company. I used Tableau for comparison. Next, I built a recommender system based on the financial data of the companies (not limited to revenue, profit and fortune 500 rank) because I felt that a company would want a direct comparison with its competitors. Hence, I used KNN algorithm to find the financially nearest company of Capital One.
Dashboard creation: As HR department of a company would be using this tool, I wanted to use a tool that could easily be understood and worked with in case of any changes. Hence, I decided to go ahead with Tableau and assembled all my work as a dashboard. Please find below a demo of my dashboard:
Where can this be used? This tool can be used by companies to see what others are doing better and work on that. It can also be used by a company to compare its branches.
*There were around 200 people registered for the hackathon and I took part as an individual.***Comparisons may not be very accurate in the demo as webscaping for demo purpose was done only for limited reviews.
Another Data Science Hackathon that I Won: Nasdaq
Tools Used: Web Scraping, Python, Time Series, NLP